San Jose-metro other services jobs, September 2026
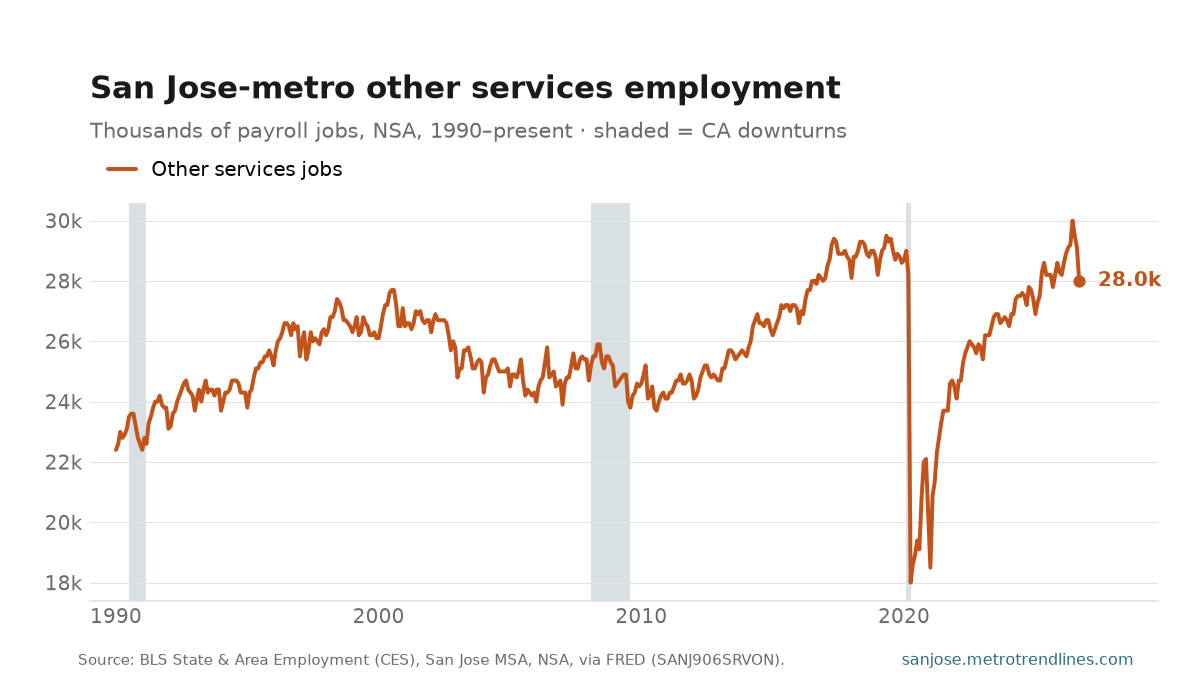
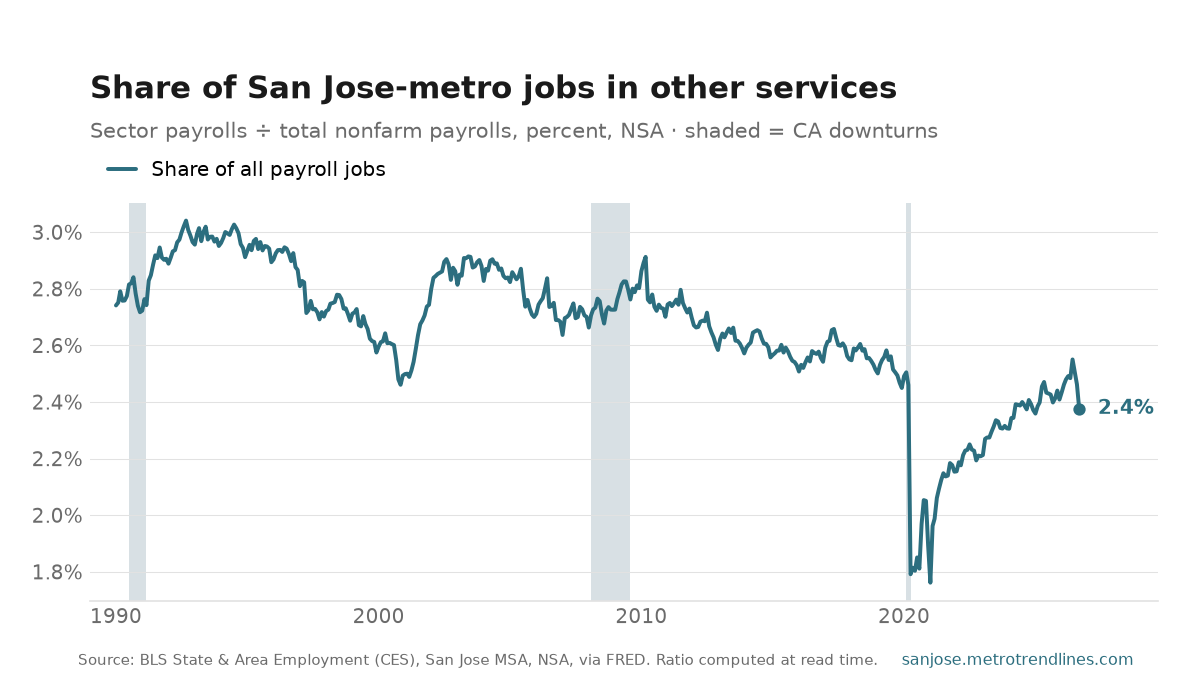
San Jose-metro other services employers had 28,000 people on payroll in September 2026, up 0.7% from a year earlier. That is 2.4% of all payroll jobs in the metro, against 2.4% a year before.
The small, neighbourhood-scale part of the economy: repair and maintenance shops, hair and nail salons, dry cleaners, funeral homes, religious congregations, unions and civic and professional associations. It is the sector most made of face-to-face work in small businesses, which is why the spring of 2020 hit it so hard — and why its count is worth watching for whether it ever gets back to where it was before.
The two charts answer different questions. The count peaked at 30,000 in June 2026 and says whether the sector is hiring. The share — from 2.7% in January 1990, with a high of 3.0% in September 1992 and a low of 1.8% in January 2021 — says whether it is growing faster or slower than the rest of the economy.
Not seasonally adjusted, so compare a month with the same month a year earlier. The share is computed at read time from two series in the same BLS release, so it stays consistent when the levels are revised.
Source: U.S. Bureau of Labor Statistics, State & Area Employment, other services and total nonfarm payrolls, San Jose–Sunnyvale–Santa Clara MSA, not seasonally adjusted, via FRED (SANJ906SRVON, SANJ906NAN). The share is derived at read time. Auto-generated each build.