311 service requests in San Jose, August 2026
city services
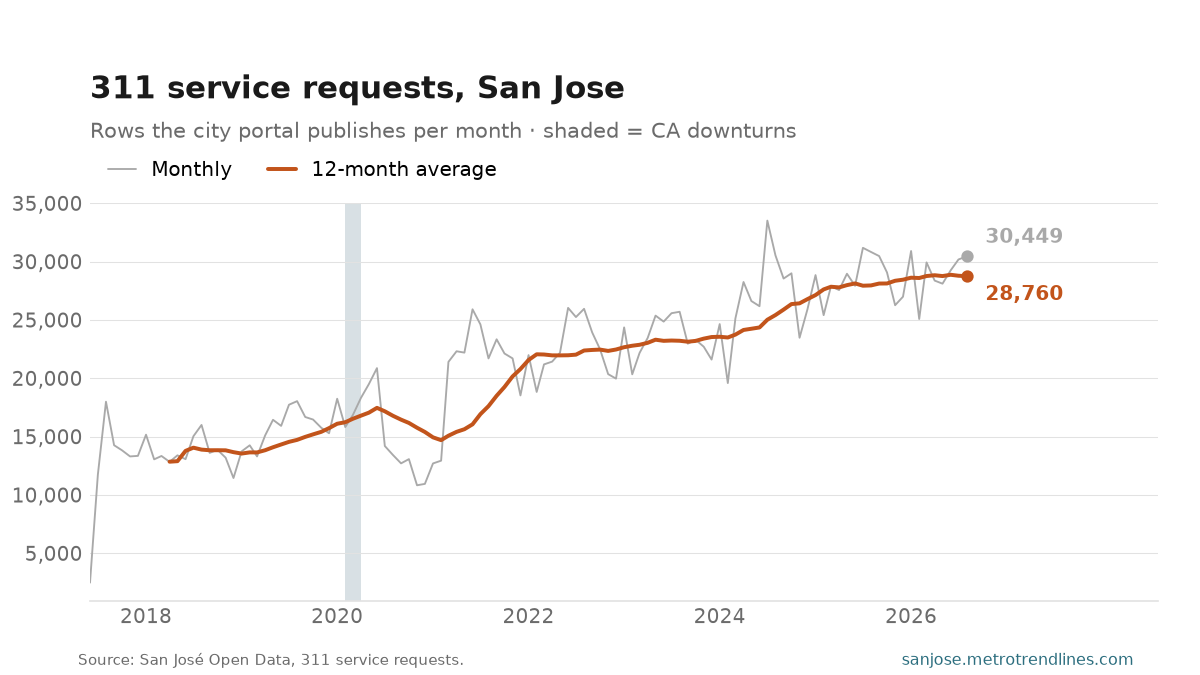
San Jose’s open-data portal lists 30,449 311 service requests for August 2026, down 1.2% on a year earlier. The 12-month average is 28,760 a month.
A service request measures how many people ask the city for something, not how many problems exist. A new app, a campaign or a change in what counts as a request moves it without any change in the street.
The heavier line is the 12-month average, which takes out the seasonal swing; compare a month with the same month a year earlier rather than with the month before. The newest month is left out until it is complete.
Source: San José Open Data, 311 service requests, counted by month. Auto-generated each build.