San Jose-metro manufacturing jobs, September 2026
economy
employment
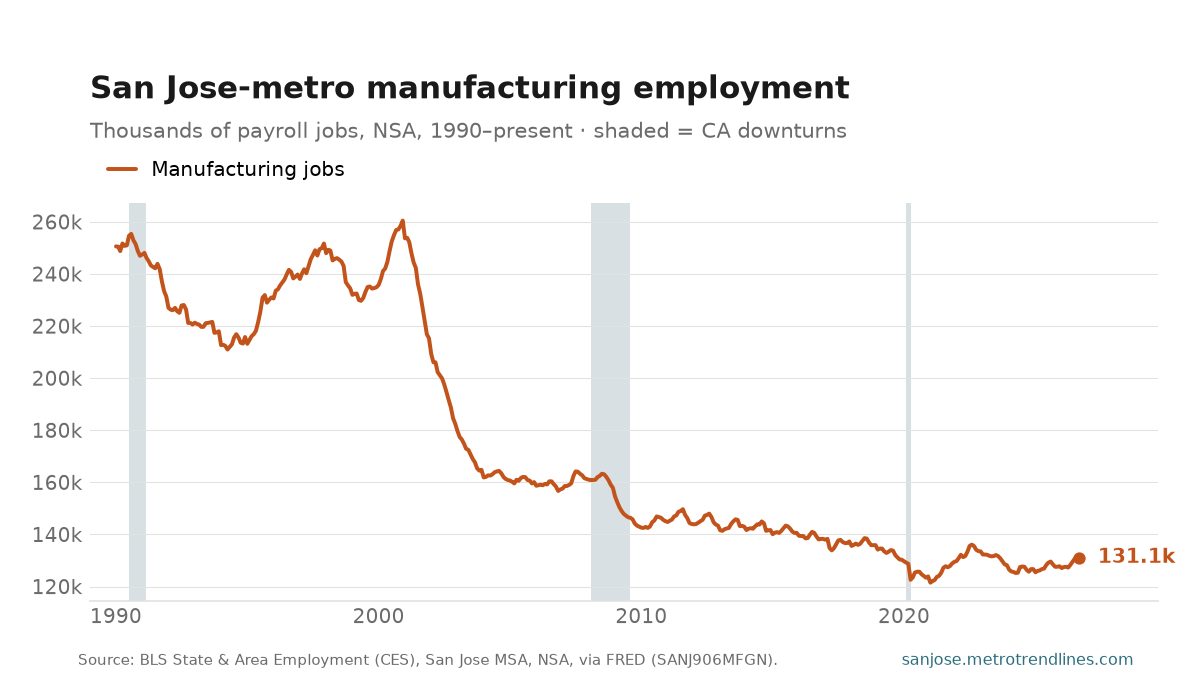
San Jose-metro manufacturers employed 131,100 people in September 2026, up 2.0% from a year earlier — 11.1% of all payroll jobs in the metro. The sector peaked at 260,500 jobs in December 2000 and has shed roughly 50% of that since.
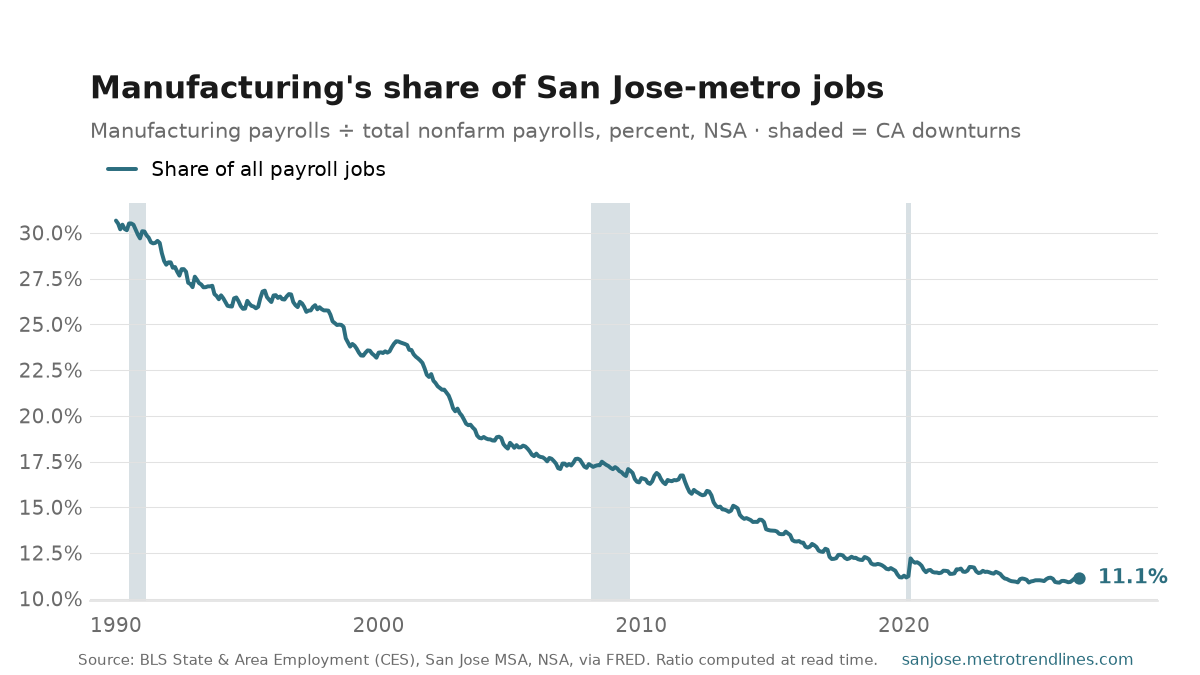
The second chart is the share: it went from 30.7% in January 1990 to 11.1% now.
Numerator and denominator of the share come from the same BLS release for the same metro, so it stays consistent when the levels are revised; it is computed at read time, never stored.
Source: U.S. Bureau of Labor Statistics, State & Area Employment, manufacturing and total nonfarm payrolls, San Jose–Sunnyvale–Santa Clara MSA, not seasonally adjusted, via FRED. The share is derived at read time. Auto-generated each build.