California jobless claims, week of Sep 26, 2026
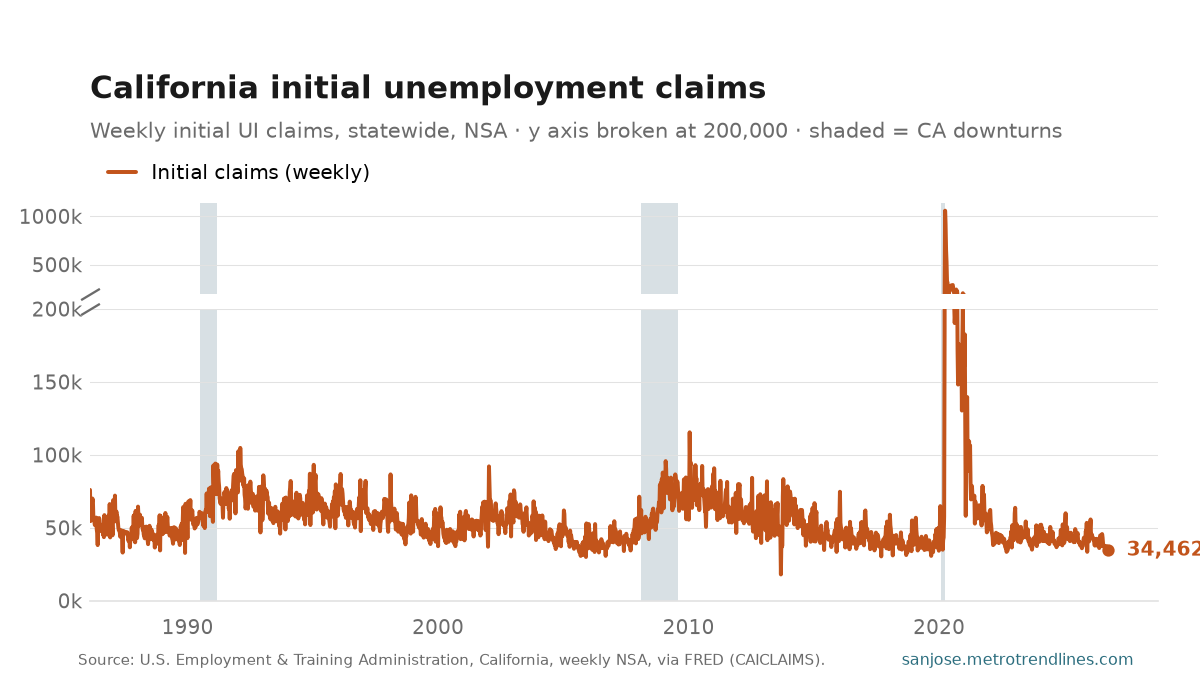
California workers filed 34,462 initial unemployment claims in the week ending Sep 26, 2026; the steadier four-week average is 34,840, down 8.5% from the same weeks a year ago.
Read the chart in two parts. The y axis is broken at 200,000. Below the break is where this series lives: almost every week since 1986 is in that band, and on its own scale the normal shape is plain — a spike every winter as construction and seasonal retail lay off, and a sustained rise through 2008-09. Above the break, on a compressed scale, is the spring of 2020, when claims reached 1,058,325 in the week of Mar 28, 2020. On a single axis that one episode flattens 40 years into a line along the floor.
Claims are the fastest labour-market number there is — a week old when published — and the noisiest. One week is a data point; the four-week average is the reading. Statewide, not seasonally adjusted, so compare with the same weeks a year earlier rather than the week before.
Source: U.S. Employment and Training Administration, initial unemployment-insurance claims for California, weekly, not seasonally adjusted, via FRED CAICLAIMS. Auto-generated each build.